Im using Aerospike with storage-engine memory, AFAIK all records (primary id + payload) will be stored in memory.
I set the storage size to 30GB on Aerospike.conf, however i found out that Aerospike will reserve that many size on startup and proceed to write at maximum of 2 times that; So for example in my case, system will reserve 30GB first and write data until maximum of 60GB;
On further testing i also found out that stop-writes triggered when my usage memory around 48GB, of course i set threshold pct to 90
My questions
Why and for what purpose that allocation 2x of storage size?? AFAIK i couldn’t find this mentioned in documentation
Why my stop writes triggered if the allocation is far than full? Or does Aerospike see the full pct against 30GB instead of actual 60GB?? My data is around 30GB btw
Any advice or formula to determine correct memory needed for storing records with 20mins TTL with 30GB? My incoming TPS is around 100k
Based on the server version you are using, you might want to review this section https://aerospike.com/docs/database/manage/namespace/storage/config/#setup-in-memory-without-storage-backed-persistence and check. (I would also suggest using an 8 multiple memory-size - so 32GB instead of 30GB.) What is the server version you are testing with? There were changes with respect to storage configuration in version 7.0 onwards. (I asked the previous question to ensure you were not overrunning memory while stop writes condition is checked by server, which is every 10 seconds.) Are you updating the same records in your 100K TPS workload or writing new records with 20 min TTL?
Yes, server config is already looks like that, it doesnt matter whether its 8 multiplier or not, the point is, server will eventually takes twice memory (not immediately) so in my case, if i set 30GB, server will hug 30GB first, when traffics inserted, the usage is increased, in my case, the traffic is stable in around 47-48GB; I dont mind about memory usage, but i just wanna know, why does it behaves this way
Im using Aero 8, with below scenario
I have 2 services (called sink & joiner), sink wil consume from 2 kafka topics with avg 100k tps, then insert them to two sets in Aero (lets call this set LEFT and RIGHT); Joiner will scan set LEFT and for each record, scan RIGHT; If there is a record with same primary id on RIGHT, get them both and emit to kafka topic, after that, delete the records from LEFT and RIGHT
So basically, im always writing new records with 20 mins TTL for LEFT and 15 mins TTL for RIGHT, the size of BOTH sets on avg 15-20mins is supposedly below the threshold i defined in config
2 - how are you measuring memory used? Using top command?
3 - Have you defined any secondary indexes?
I was looking at the documentation here: Metrics Reference | Aerospike Documentation and in the detail, it shows an example where namespace has 5 files of 96 MiB, 24 MiB data in each, but spread in 48 MiB write-blocks … so data_avail_pct (free blocks - 96-48 / 96 )= 50% makes sense, but how they are getting data_used_pct as 75% is also confusing me. Should be 24/96 = 25%. I am missing something.
namespace bar {
        replication-factor 2
        default-ttl 900
        stop-writes-sys-memory-pct 90
        evict-indexes-memory-pct 80
        nsup-period 60
        nsup-threads 2

        storage-engine memory {
                data-size 30G

                # To use file storage backing, comment out the line above and use the
                # following lines instead.
#               file /opt/aerospike/data/bar.dat
#               filesize 30G
        }
}
Yes, Im using top command to see available memory, also i found that there are sometimes ‘unreleased’ memories on VM even when Aero is stopped, the VM has to be restarted to free this.
For my case currently, I don’t define any secondary indexes
Could you share the data_used_pct and data_avail_pct metrics using asadm? That will tell us what actual data you have. top gives memory used by the entire aerospike process. The 30GB allocation you see upfront is from the data-size declaration - I think of it as aerospike filling that entire space with placeholder dummy bytes waiting for real data to come in. You should be hitting stop writes at 70% of 30GB ( data_used_pct = 70 ) , or overall system memory hitting 90%, that includes aerospike and any other processes running in the VM. In your case, since you are inserting and deleting rapidly, you could have a high defrag load and may hit stop-writes on data_avail_pct = 5 which is free “write-blocks” available within the 30GB budget, falling below 5%. So, the metrics will help understand what is going on.
asadm -e 'show statistics namespace for <namespace name> like data'
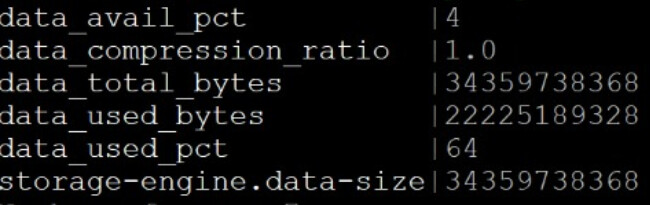
This is the output in VM where we set data-size = 32G
New found, i mentioned before that there were unreleased memory; This happens when we decrease the data-size and restarted the Aerospike
E.g. from 64G to 32G, this is unreleased, we must reboot the VM to free the hogged memory;
No issue when increasing data-size though;
As I suspected, you are hitting stop-writes because you are running out of free write-blocks due to high defrag type of pattern - writes and immediate deletes. Your data usage is at 64% of 32GB .. so not causing the stop-writes. You can probably make defrag more aggressive and try. Plz see this config param: defrag-lwm-pct Try slowly increasing it from default 50% to say 55% … I wouldn’t try to go higher than 60%. If your write-block is 8M size, as you delete records in a write-block, once it has only 4M worth of remaining good data (defrag-lwm-pct 50 default), two such write-blocks are combined and written to a new write-block by the defrag thread running in the background. So 50% is really optimal. If you set to 55%, the blocks becomes eligible a bit earlier but you are adding more work on the server towards defrag and it may at some point affect your application front end performance.
You are at the boundary of your capacity – used pct is at 64% .. you can squeeze a bit more to 70% … or bump that config param from 70 to higher, say 75 to squeeze some more.
So really, you could tune stop-writes-used-pct and defrag-lwm-pct a bit more and squeeze some more but does not look like there is too much room to extract much more.
That was your original issue, and an interesting question. I will have to reproduce it in ver 8.1 to validate it. Wondering if the process is just hugging the memory that it had used earlier and not released it back, after done defragging, back to the system? It really should be working within the initial 30GB or 32GB grab at startup for this namespace. The process itself takes 1 or 2 GB. That’s why I earlier wondered if you were declaring Secondary Indexes - but that too cannot account for that much overdraw - worst worst case could be 4GB at start (256 max SIs declared, none populated).
Perhaps someone else may have something to add. Pure memory storage mimics device storage since ver 7, I believe.